In 2023, the U.S experienced economic growth alongside a general contraction in tech hiring. Higher interest rates reshaped both the funding environment and the demand-side of technology, leading to mass layoffs across the tech sector.
Do layoffs work? Well, you can find many answers online. This article has some good insights:
The majority of firms that conduct layoffs do not see improved profitability, whether measured by return on assets, return on equity, or return on sales.
The more important question is: does the perception that layoffs improve company operations influence decision-making? Here we run into an feedback loop as well as a contagion effect: general tech slowdown → layoffs → perception that layoffs work → other companies lay off → general tech slowdown.
Perception becomes reality, especially for startups dependent on funding rounds that may no longer be secured. Interestingly enough, however, raising more money may come at the expense of the workers themselves.
Our analysis showed:
A 1% unit increase in funding is correlated with a 0.156% increase in layoffs. (p-value=0.004)
Certain industries had higher sensitivity to funding increases and layoffs numbers.
Modelling Approach:
To explain our model, we hypothesized that companies with lower funding would experience the same number of layoffs as those with higher funding.
Model 1: Funding and Layoffs
Our first, unlogged model is a linear regression. It focuses on the relationship between funding and layoffs where Layoffs was the dependent variable on the left side and Funds_Raised was the independent variable on the right side. Both variables resulted in a positive skew, so we applied log transformations to normalize the distributions. Log transformations help to reduce the effect of outliers.
Model 2: Adding Industry
Next, to better understand the drivers of layoffs, we included industry as an additional categorical predictor in our second model. Since different industries face unique economic pressures and funding environments, we wanted to see whether layoffs were concentrated in specific sectors or reflected a broader pattern. The revised model is the following:
You can start to see the effects of industry on layoffs below:
Figure 1: A heatmap of which industries were most affected in 2023.
Model 3: Adding Stage
To improve the explanatory power, another factor (stage) was added to further explain the variation and to analyze its effect on logged layoffs. Since a company’s stage (ex. early stage, post-IPO, etc.) often correlates with funding levels (higher stages have higher levels of funding with a correlation of 0.5), we added this as an interaction term.
This last model, while accounting for the interaction between funding and stage, introduced unnecessary complexity into our model. It ultimately moved funding away from significance, suggesting that layoffs may depend more on the company's stage than on the funds raised.
Polynomial models were explored but led to overfitting, as evidenced by significant gaps between R² and adjusted R² values.
Model Assumptions:
Ultimately, we are operating off the large sample assumptions:
Independent and Identically Distributed (IID):
The IID assumption assumes that layoffs occur independently across the companies. This might not really hold. 2023 was a year of economic transformation, when the Fed raised rates dramatically, reducing capital flows and investment appetites for tech. You saw the FAANG companies lay off in clusters during similar time periods, indicating some contagion effect when it comes to business operations. Indeed, you can even read it in the CEO letters—which started to all sound the same—speaking of the “Year of Efficiency.”
A unique Best Linear Predictor (BLP) exists.
The BLP assumption shows that the model captures the best possible relationship between funds raised and layoffs. By applying a log transformation for Layoffs and Funds_Raised, we normalized the data with less heavy tails. We also calculated the variance inflation factor (VIF) to confirm that the predictor and response variables have no perfect collinearity if the value is below the threshold of 5. The computed VIF value is 1.606. As a result, we verified that a unique BLP exists for our model.
Model Results:
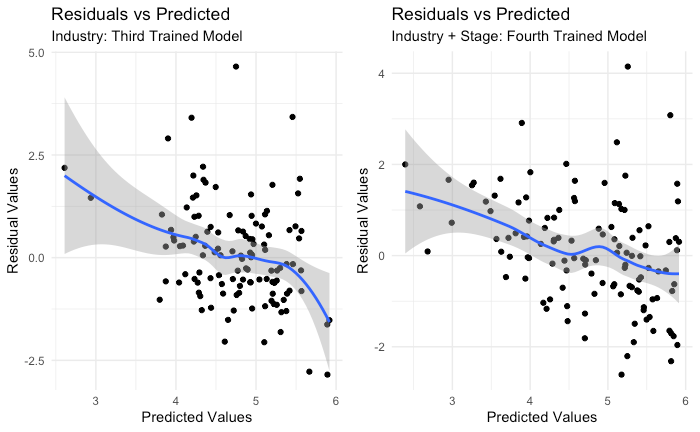
Our residual plots indicate that the model successfully captured some key relationships, though challenges remain. Notably, the interaction of funding and stage complicates predictions, and broader economic conditions likely overshadowed our model’s variables.
Figure 2: A residuals vs. fitted values plot for the third and fourth models.
You can see from the residual plots that our model is starting to do a better job of fitting the data. A flatter line, as long the points are randomly distributed, indicates a better fit. We can start to fill out the coefficients for funding influencing layoffs: a 1% unit increase in funding is correlated with a 0.156% increase in layoffs.
Takeaways and Limitations:
The major IID assumption might be violated—tech companies clearly influence one another, especially if stock prices are temporarily affected by temporary layoffs. This interconnectedness could lead to the clustering of layoffs that are driven more by perception.
Putting my HR hat on, I would also not be surprised if seasonality plays a role in layoff patterns. Business cycles tend to follow a rhythm (even in tech), and many layoffs happen during the winter months, closer to business planning (either before or after) for the next fiscal year. These factors could introduce patterns that our current model doesn’t fully capture.
Next Steps: This analysis offers a glimpse into econometrics. However, it’s extremely difficult to hone down the temporal effects; clearly, as the economy changes, the patterns of workforce management change as well. We are quite interested in incorporating supplemental datasets that could improve our analysis. Comment with a few suggestions!


